Monitoring
When the deployment finishes, you should be able to connect to the Replicator service by using port forwarding:
$ kubectl port-forward -n es-replicator svc/es-replicator 5000
The Replicator web interface should be then accessible via http://localhost:5000. The UI will display the replication progress, source read and target write positions, number of events written, and the replication gap. Note that the write rate is shown for the single writer. When you use concurrent writers, the speed will be higher than shown.
Prometheus
If you have Prometheus in your Kubernetes cluster, we recommend enabling prometheus.metrics option. If the prometheus.operator option is set to false, the deployment will be annotated with prometheus.io/scrape.
If you have Prometheus managed by Prometheus Operator, the scrape annotation won’t work. You can set both prometheus.metrics and prometheus.operator options to true, so the Helm release will include the PodMonitor custom resource. Make sure that your Prometheus custom resource is properly configured with regard to podMonitorNamespaceSelector and podMonitorSelector, so it will not ignore the Replicator pod monitor.
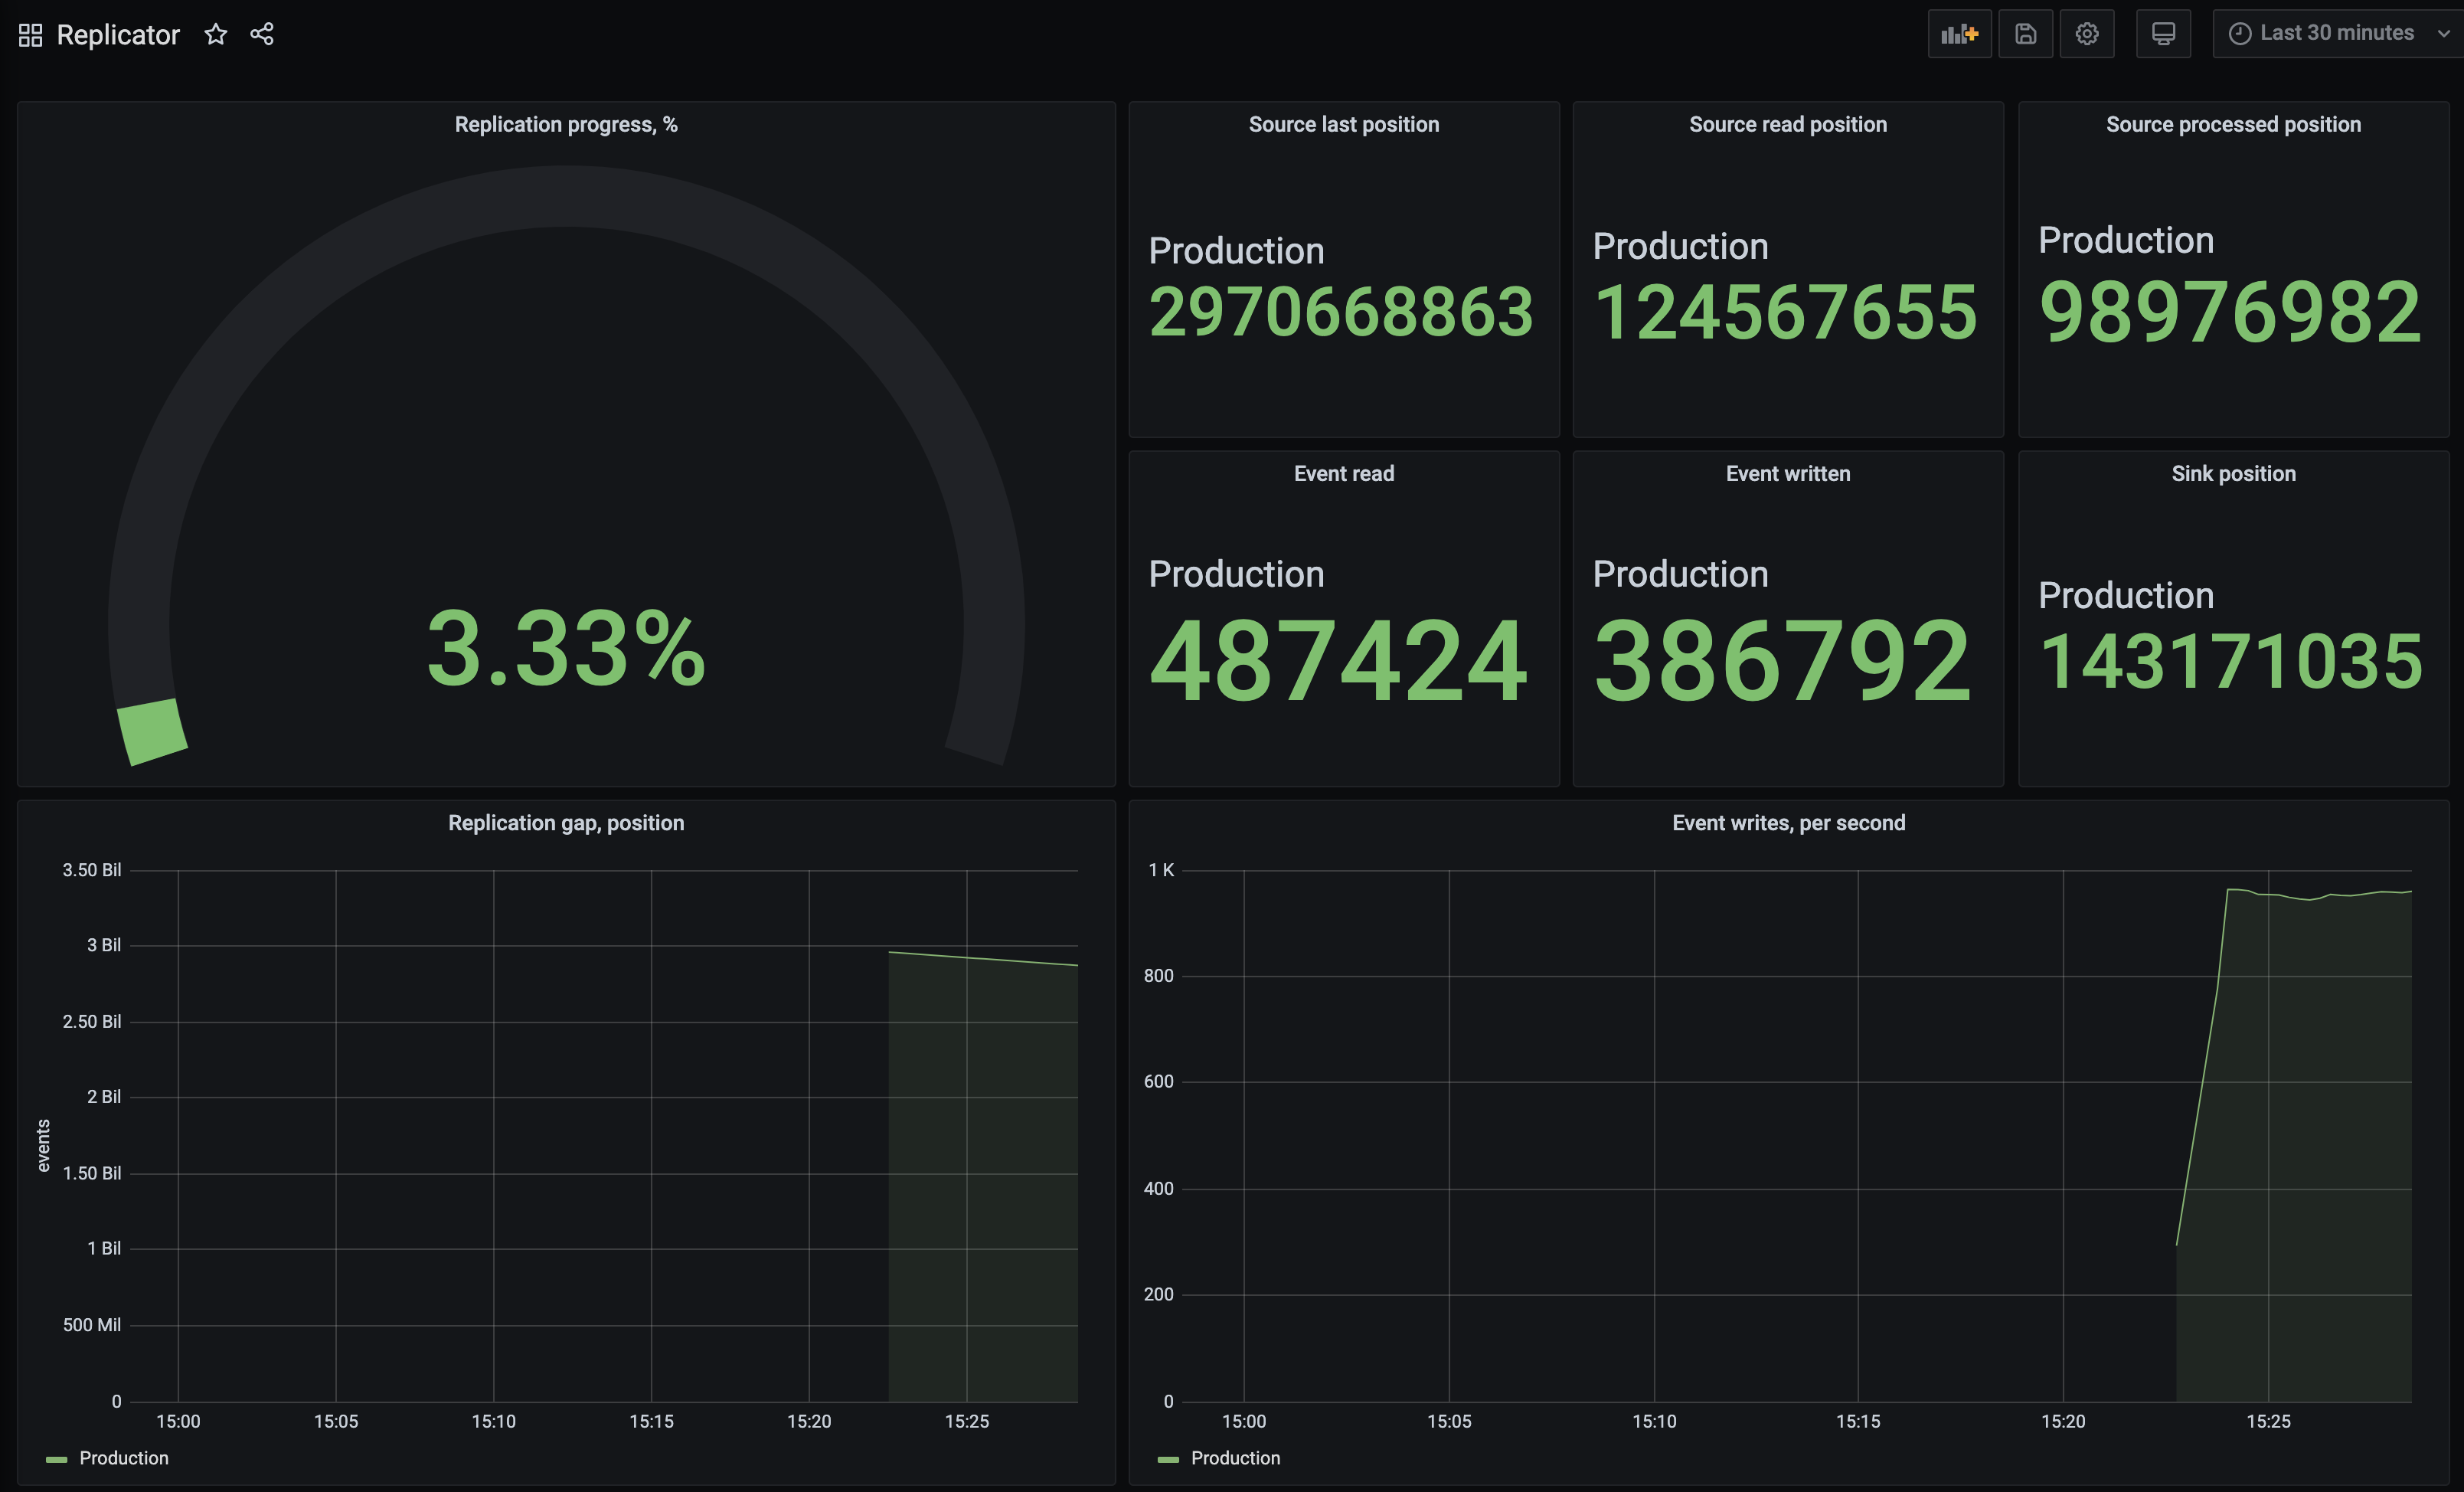
Grafana
The best way to monitor the replication progress is using Prometheus and Grafana. If the pod is being properly scraped for metrics, you would be able to use the Grafana dashboard, which you can create by import it from JSON file.